


You're at the kitchen table, a browser full of university tabs open, and your child is trying to stay calm while you both stare at numbers like 12%, 44%, or 68%. It's easy for that moment to feel loaded with meaning, as if one figure could decide your child's future. In reality, university acceptance rates are only one part of a much bigger picture, and they often say more about the application system than about one student's potential.

A helpful way to start is to treat a headline rate as a conversation starter, not a verdict. If your child is interested in a future requiring focused planning, even a resource like the Google internship application guide 2026 can remind families that strong outcomes usually come from thoughtful preparation, not panic over one number. The same logic applies to university admissions, where the question is what the rate means for your child, their course, and their strengths.
What University Acceptance Rates Really Mean for Your Child
A parent can look at a university website and feel two emotions at once, hope and dread. One school seems “safe”, another looks impossible, and a third sits in the grey area where no one can quite tell what the number means. That's where confusion starts, because university acceptance rates can look personal when they're really broad system figures.
A number is not a judgement on your child
An acceptance rate is not a score for your son or daughter. It doesn't measure kindness, resilience, creativity, or how much effort they're putting into revision. It only shows how many applicants were accepted in a given system, and even then it depends on how that system counts applications and acceptances.
That distinction matters emotionally. Parents often read a low rate and hear, “Your child might not be enough.” That's not what the figure says. It usually says that the course is popular, the pool is strong, or the institution is operating within a competitive admissions cycle.
Practical rule: treat the number as a starting point for research, then ask what's behind it before you let it shape your child's confidence.
Why families get pulled into the wrong comparison
The biggest mistake is comparing a child's chances at a broad university with their chances on a very specific course. A student applying for history and a student applying for medicine are not facing the same admissions reality, even if they're looking at the same institution homepage. That's why families can feel misled when a university looks “average” overall but is much tougher in the subject they want.
Parents also carry the emotional weight of wanting to protect their child from disappointment. That instinct is caring, but it can lead to overreading the headline number. The better approach is to ask what the figure covers, who it includes, and whether it reflects the course your child wants.
When families shift from fear to curiosity, the conversation changes. The number stops being a threat and becomes one useful clue among many.
How Acceptance Rates Are Calculated in the UK
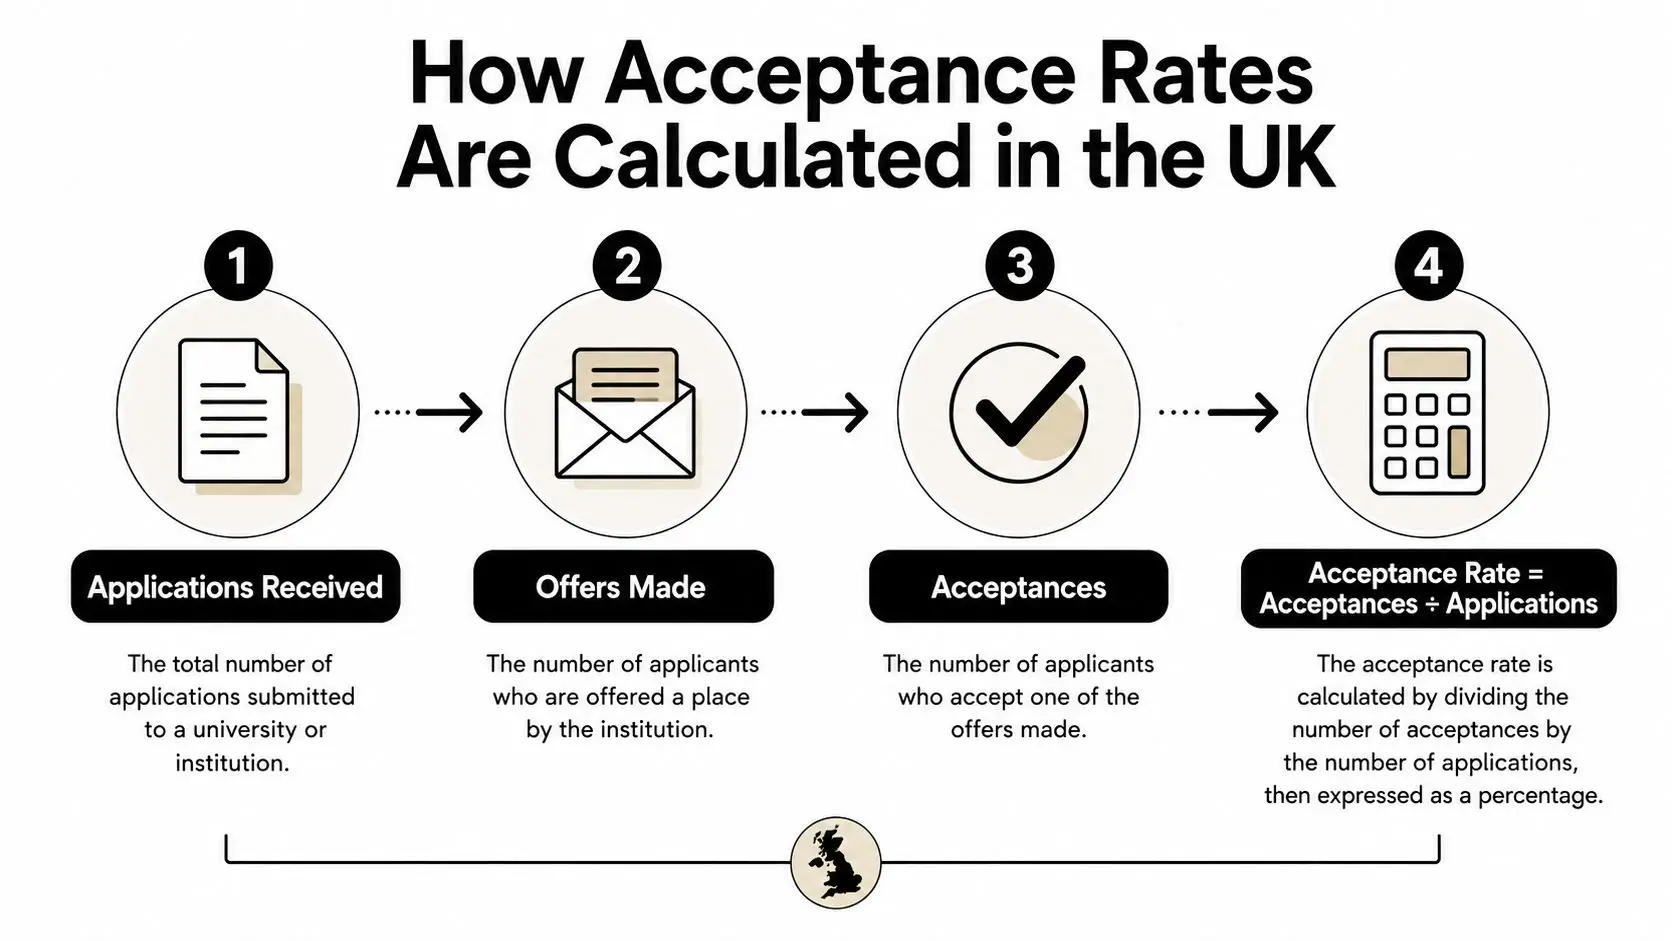
In the UK, acceptance rate is the number of acceptances divided by the number of applicants, using UCAS data. It is an admissions conversion rate, which helps explain how many applicants were accepted in a cycle, but it does not predict whether one child will be offered a place. A university's headline figure can change because more people applied, because fewer people applied, or because the balance of applicants changed.
The clearest way to read this is through the sector-wide UCAS picture. For the 2023 admissions cycle, UCAS reported 677,790 applicants, 463,380 accepted applicants, and 493,945 placed students, which works out to about 68.4% of applicants being accepted and about 72.9% being ultimately placed. UCAS also noted that this was a record year for acceptances, so access widened even while the most selective institutions remained competitive. UCAS end-of-cycle admissions figures
A family can read that figure as a reminder that the system is larger than one university's brochure. It shows how many applicants moved through UCAS successfully, not how easy every course was to enter.
Why the same percentage can mean different things
A single percentage hides the shape of the applicant pool. If one year brings in many more ambitious applicants, the acceptance rate can fall even if the university did not become stricter. If applicant volume drops, the rate can rise without the school becoming easier in any meaningful sense. That is why parents should not treat a headline percentage as a fixed measure of quality or difficulty.
The 2024 cycle points to the same lesson from another angle. About 565,000 applicants were accepted from roughly 758,000 applications, which suggests an overall success rate of about 74–75% for full-time undergraduate study. That does not mean every child has a three-in-four chance at their chosen university, it means the system-wide picture is broader than many people assume. UK undergraduate acceptance guidance
Practical rule: if the number is shown without application volume, offers, and acceptances, it leaves out important context.
A simple way to read the data
The UCAS calculation gives families a common baseline. It is easy to misuse if it gets treated like an individual forecast. A child's chances depend on course demand, predicted grades, and how they compare with other applicants, not on one national percentage taken from a webpage.
For families working on predicted grades and subject choices, a UCAS tariff points calculator can help them see how qualifications translate into entry requirements.
The process below shows why the same university can look more or less selective from one cycle to the next.
Why Headline Acceptance Rates Can Mislead Families
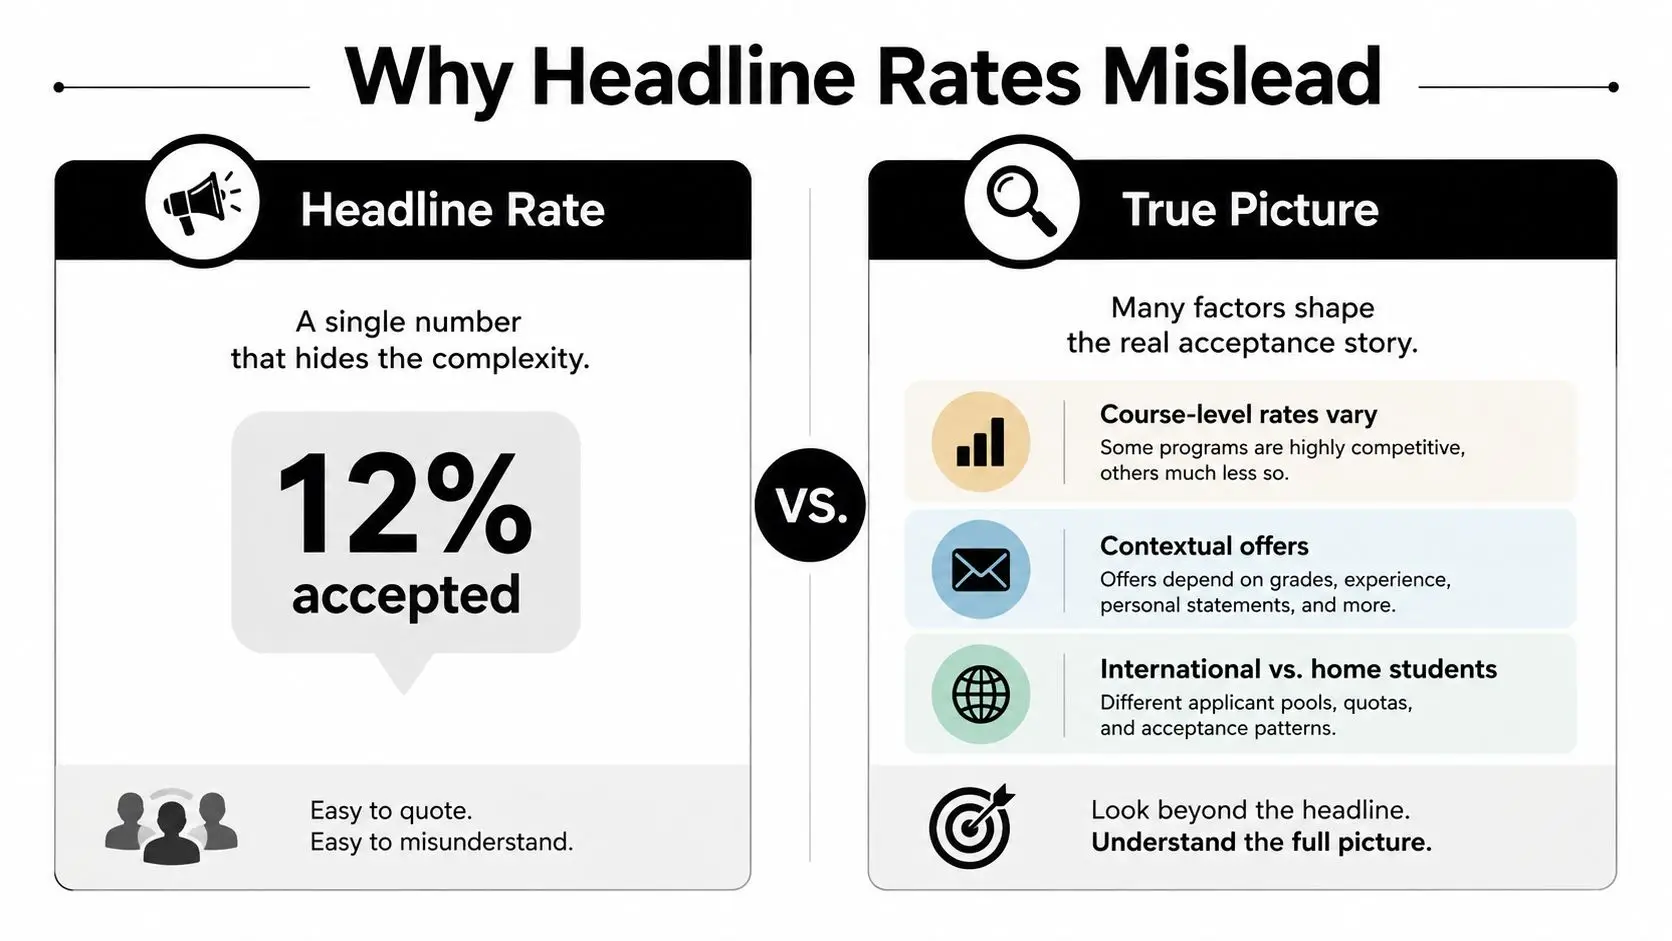
A low headline rate can feel impressive, but it doesn't always tell you what matters for your child. A parent might assume a university with a tiny overall percentage is automatically “better”, while another family sees a broader rate and assumes it's easy to enter. Both reactions miss the detail.
Course level matters more than the homepage number
The hardest part of admissions isn't always the institution, it's the specific course. Medicine, law, and engineering can be much more selective than a university's overall figure suggests, so a family looking only at the homepage can get the wrong impression. A child applying for one subject may face a sharply different process from another student applying to the same university.
That's why university-wide acceptance rates can blur the picture. They combine many courses, many applicant profiles, and sometimes very different admissions standards. A family researching only the headline statistic may think they've learned something precise when they've only seen a summary.
Fair access changes the meaning of the rate
There's also a fairness issue. OfS analysis shows that 18-year-olds from the most advantaged areas were 2.4 times more likely to enter higher education and 5.7 times more likely to enter higher-tariff providers than those from the least advantaged areas in 2018. That means the admissions picture is shaped by background, not just ambition or effort. OfS contextual admissions insight
UCAS also notes that offer rates depend on both predicted grades and course choice. So when parents ask, “What's the acceptance rate?”, the better question is, “What's the acceptance rate for my child's course, with their predicted grades, and from their background?” That's a more honest way to understand opportunity.
“Look at the pathway, not just the percentage.”
For many families, this is the turning point. The goal isn't to chase a low number for status, it's to find the best fit where your child can thrive without being boxed in by an oversimplified statistic.
Comparing Acceptance Rates Across UK Universities and Subjects
Families often want a straight answer to a very human question, “Is this university hard to get into?” The honest answer is that the range is wide. UK-focused commentary notes that some institutions sit around 44% overall acceptance, while others are much more selective, with St Andrews described at about 8% and Cambridge commonly admitting only about 11–12 out of every 100 applicants. UK university acceptance rate guide
How to read the spread
A parent shouldn't read those figures as a league table of worth. They show how different institutions position themselves, how much demand they attract, and how tightly they manage entry in particular subjects. That means a child who is a strong candidate for one course may still face a very different challenge elsewhere.
| University Type | Approximate Acceptance Rate | Selectivity Level |
|---|---|---|
| Broad-access institutions | Around 44% | Moderate |
| Selective universities | Lower than broad-access providers | Competitive |
| St Andrews | About 8% | Very selective |
| Cambridge | About 11 to 12 out of every 100 applicants | Highly selective |
The subject picture matters just as much. A child who loves science and is aiming at medicine will need to think differently from a child applying for a less crowded route. The same university may be welcoming in one subject and much more exacting in another.
University entry requirements guide
Why balance matters in a university list
Careful planning helps. Families need a list that reflects ambition without turning every option into a gamble. A balanced list usually includes aspirational choices, realistic choices, and choices where the child's profile lines up well with the course expectations.
Practical rule: a “good” list protects confidence. It doesn't force every application to carry the same emotional weight.
The newer UK trend data adds another layer. UCAS reports that acceptance rates for 18-year-olds from all SIMD quintiles had risen to over 70%, with the largest increase among applicants from SIMD20 areas, while the highest acceptance share still remained among the top SIMD quintile. That's a reminder that admissions can expand overall while inequalities still persist. UCAS area background data
Practical Strategies to Strengthen Your Child's Application
The best applications rarely come from last-minute panic. They come from steady preparation, honest reflection, and choices that match the child's strengths. Parents can help most when they focus on fit, confidence, and consistency rather than on forcing a checklist that doesn't suit their child.
Build the academic base early
Course choice matters, especially at A-Level. A child aiming for a competitive subject should choose qualifications that align with the entry route they want, rather than picking subjects because they seem easy or because friends are taking them. Strong GCSE foundations also matter because they shape confidence, subject readiness, and predicted grade conversations later on.
Predicted grades influence how offers are made, so family discussions about schoolwork should stay grounded and calm. If a student is struggling in one area, targeted support can be more useful than pressure. A child who feels understood usually performs better than one who feels constantly compared.
Make the personal statement sound like the child
Admissions tutors can tell when a statement is padded with generic enthusiasm. What usually stands out is authentic interest, reflection, and evidence that the student has explored the subject beyond the classroom. That can mean reading, listening, making notes, or connecting school learning to a wider question.
How to write a personal statement
Here's the difference in practice:
- Subject reading: A sociology applicant discusses a book or article that changed how they think.
- Work experience: A health-related applicant reflects on what they observed, not just where they went.
- Independent exploration: An engineering applicant explains a small project they built or tested.
- Teacher support: A recommendation becomes stronger when the teacher can describe curiosity and persistence.
- Interview preparation: A student practises explaining their thinking clearly under pressure.
Use choices wisely, not fearfully
UCAS gives applicants five choices, and that structure works best when families use it strategically. One or two options can stretch the child, but not every choice should be a reach. The goal is to protect motivation, reduce avoidable stress, and make sure the student still feels hopeful after each application.
A child who is genuinely interested in the course will usually give a stronger application than one who is pushed into prestige alone.
Contextual admissions can also matter for some applicants, so it's worth asking schools and universities how they assess background, opportunity, and predicted grades together. The strongest applications aren't always the most polished on paper. They're the ones that make sense for the person behind them.
How Personalised Learning Environments Support University Preparation
Some students need more than a standard timetable to reach their academic potential. Small class sizes, subject-specialist teaching, and timely feedback can help a child develop stronger habits, clearer understanding, and more confidence in class discussions and written work. Those are the foundations that make later applications feel less like a leap and more like a natural next step.
When the setting matches the learner
A personalised learning environment can help a child stop hiding their weak spots and start working on them properly. For some students, that means more time to ask questions. For others, it means learning in a calmer setting where they can think without social pressure getting in the way. That matters for both academic outcomes and emotional wellbeing.
Flexible schedules can also create room for the kind of experience that strengthens an application in a real way. A student might use that space for subject reading, a project, or meaningful extracurricular involvement rather than being stretched thin by a rigid routine. The point isn't to keep children busy, it's to help them grow in a way that feels sustainable.
Why authenticity shows up in applications
: When learning is personalized, students often understand their own strengths more clearly. That makes personal statements more convincing because they sound like a real teenager thinking carefully about a real subject, not a script copied from the internet. It also helps children with SEN or SEMH needs, because support that fits the child can reduce stress and keep them engaged.
Queen's Online School is a Pearson Approved Examination Centre, so students can work towards internationally recognised GCSE and A-Level qualifications while staying on a pathway that supports university entry worldwide.
The best preparation often looks quieter than families expect. It's regular, supportive, and shaped around the child rather than around a headline target.
That kind of setting doesn't just improve study habits. It helps a child feel that their education is built around them, which is often the difference between surviving school and growing through it.
Looking Beyond the Numbers to Your Child's Unique Journey
Acceptance rates matter, but they should never become a child's label. They're system-level figures, shaped by course demand, applicant mix, predicted grades, and background, so they're useful only when families read them with context. The more specific the question, the more useful the answer becomes.
For further reading, UCAS end-of-cycle reports and the OfS contextual admissions insight are the best starting points for families who want the full picture rather than the headline version. If your child also benefits from structured lecture support, a tool like iScribe Live Transcribe for lectures can make it easier to capture ideas, revisit teaching, and reduce the pressure of relying on memory alone.
What matters most is still your child. Their wellbeing, subject interests, confidence, and sense of possibility should shape the decision far more than any one figure on a webpage.
If you want an education path that supports real progress, not just test scores, Queens Online School offers a personalised British curriculum with live teaching, small classes, and a calm environment built around the learner. It's a strong fit for families who want university preparation to feel steady, supportive, and centred on the child's needs.